Setting up Sentry for Apex Interviewer
How I gave a Next.js app eyes and ears in production, from a blank white screen to a readable stack trace, with PII scrubbing along the way.
By Dumebi ·
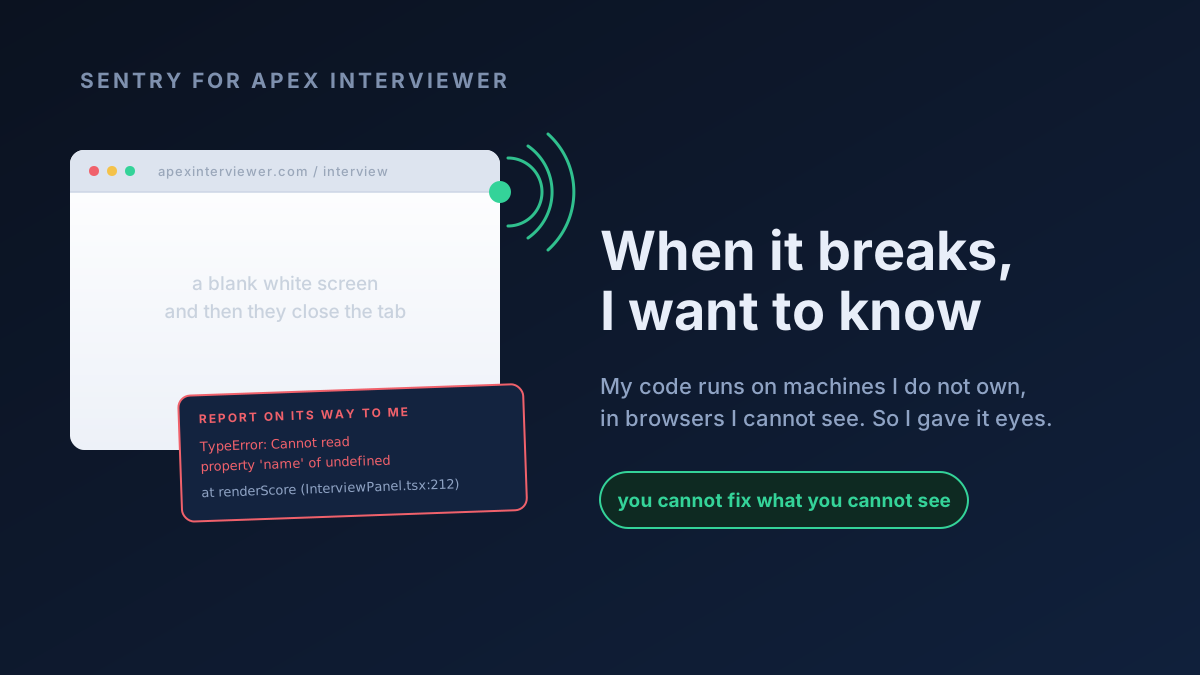
Imagine a stranger sits down at your app, somewhere on the other side of the world, on a phone you've never held. They tap a button. The screen goes white. They wait, they sigh, and they close the tab.
And here is the sad part: you will never hear about this. There is no bell that rings on your desk. The user is gone, and so is any trace of what went wrong. From where you sit, nothing happened at all.
This is the quiet horror of shipping software. Your code runs on machines you don't own, in browsers you can't see, and when it breaks it breaks silently. Apex Interviewer (the interview practice app I build) runs voice interviews, talks to Stripe, syncs with Airtable, and streams audio back to people in real time. There are a hundred places it can go wrong, and almost all of them happen very far away from me.
The first job, before anything clever, is simply this: when the app breaks, I want to know. That is what error monitoring is, and the tool I reached for is called Sentry.
What a stack trace actually is
Before we talk about Sentry, let us talk about what we even want to capture in the first place.
When a program hits something it can't handle (it tries to read a name off a customer who turns out to be undefined, say) it throws an error. An error is just an object that carries a message ("Cannot read property 'name' of undefined") and, more importantly, a stack trace.
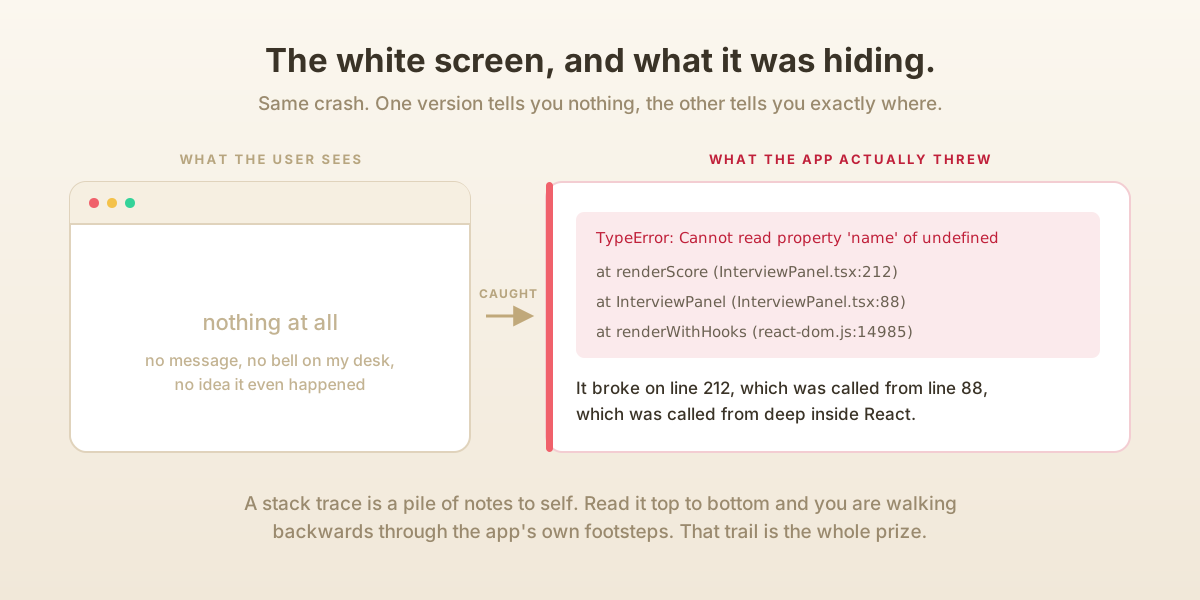
A stack trace is basically a list of breadcrumbs. Every time one function calls another, the program remembers where it was, like a stack of notes-to-self piling up on a spike. And when the error happens, that whole pile is dumped out, newest first:
TypeError: Cannot read property 'name' of undefined
  at renderScore (InterviewPanel.tsx:212)
  at InterviewPanel (InterviewPanel.tsx:88)
  at renderWithHooks (react-dom.js:14985)
Read it top to bottom and you're basically walking backwards through the program's footsteps. The crash was on line 212, called from line 88, called from deep inside React. That trail is gold. The entire point of an error monitor is to catch that trail before it evaporates and mail it to you.
The DSN: an address with a key built in
To mail something, you need an address. Sentry's address is called a DSN, which is short for Data Source Name. It looks like a URL with a long random string in it:
https://abc123...@o456.ingest.sentry.io/789That random string is two things at once. It says which project the error belongs to (Apex Interviewer has its own project, apex-interviewer-web), and it carries a public key so Sentry knows the report is really coming from my app and not from some prankster. So it is basically a mailing address with the stamp already printed on it.
In the app, the DSN lives in environment variables. There are two copies, and the difference actually matters:
SENTRY_DSN=...              # used by server code
NEXT_PUBLIC_SENTRY_DSN=...  # used by browser code
The NEXT_PUBLIC_ prefix is Next.js telling the build, "this one is allowed to ship to the browser." And a DSN is safe to expose because it can only send errors in, it can't read them out. So that's fine.
Two places a Next.js app can break
Here's the wrinkle that makes a Next.js app more interesting than a plain website. The same codebase runs in two completely different worlds.
Some of it runs in the browser, on the user's machine: the buttons, the animations, the panel that renders an interview score. Some of it runs on the server, on a machine in a data center: the API routes that charge a card or fetch a question from Airtable. And Next.js has a third, in-between world called the edge, which is a stripped-down runtime that runs tiny bits of logic (like authentication checks) very close to the user.
An error can happen in any of the three, and each one needs its own little Sentry setup. So Apex Interviewer has three configuration files:
sentry.client.config.tsruns in the browsersentry.server.config.tsruns on the Node serversentry.edge.config.tsruns on the edge
Each one calls Sentry.init({ dsn, ... }), which is just handing Sentry the address and a bag of settings. They are nearly identical, and that is exactly the point: wherever the crash happens, the same net is waiting.
Next.js stitches these together through a file it looks for automatically, instrumentation.ts. Think of it as the app's ignition sequence. It runs once when each runtime boots up, and its job is to load the right config for the world it finds itself in:
export async function register() {
  if (process.env.NEXT_RUNTIME === "nodejs") {
    await import("./instrumentation-node");
  }
  if (process.env.NEXT_RUNTIME === "edge") {
    await import("./sentry.edge.config");
  }
}

export const onRequestError = Sentry.captureRequestError;
That last line is a small gift from the framework: Next.js will hand Sentry any error that escapes a server request, automatically. I don't have to wrap every single route in a try/catch and remember to report it. The browser side has its own equivalent, which is a global-error.tsx component that React renders when the whole page falls over, and which quietly does Sentry.captureException(error) on the way down. So even a total white-screen crash still gets reported. I hope you are still with me 🙂.
(One Next.js-14-specific note, just in case you hit it: instrumentation was still behind an experimental.instrumentationHook flag in next.config.js at the time I set this up. On Next 15 it is on by default.)
Source maps: making minified gibberish readable again
Now a problem that almost everyone forgets about until it bites them.
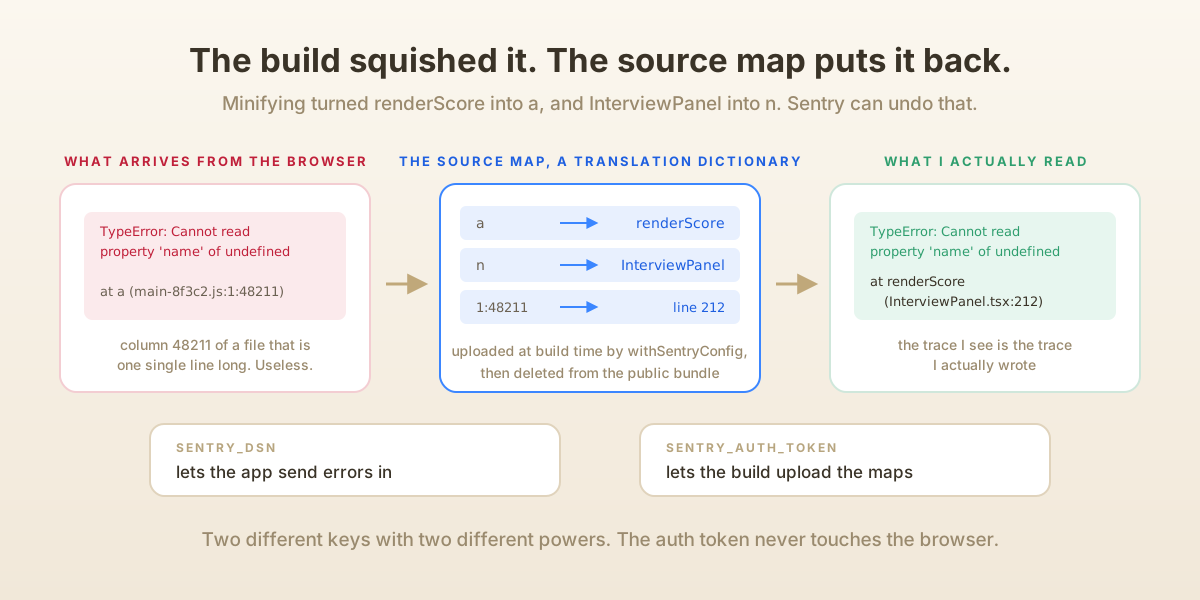
The code you write is not the code that ships. Before it goes out, a build step minifies it: it strips the comments, shortens every variable name to a single letter, and crushes it all onto a few enormous lines, so it downloads faster. So your readable renderScore becomes a, and your InterviewPanel becomes n.
Which means the stack trace that arrives in Sentry from a real user ends up looking like this:
TypeError: Cannot read property 'name' of undefined
  at a (main-8f3c2.js:1:48211)
Useless. Line 1, column 48211, of a file that is one line long. You learn absolutely nothing.
The fix is a source map. A source map is a translation dictionary the build produces alongside the minified file. It says, in effect, "column 48211 of the squished file was really line 212 of InterviewPanel.tsx, and a was really renderScore." Give Sentry the source maps and it does the translation for you, so the trace you see is the trace you actually wrote.
In Apex Interviewer this is handled by withSentryConfig wrapping the Next config. At build time it uploads the source maps to Sentry, then deletes them from the public bundle so strangers can't download your original source. To upload, it needs to authenticate, and that's a third secret, separate from the DSN:
SENTRY_AUTH_TOKEN=...   # build-time only, never shipped to the browser
SENTRY_ORG=...
SENTRY_PROJECT=apex-interviewer-web
So the DSN lets the app send errors in. The auth token lets the build upload maps and tag the release. They are deliberately different keys with different powers. The auth token never touches the browser, it lives only on the build machine. I hope at this point you are not confused.
There's a small but lovely detail here too. Each build is stamped with the exact git commit it came from (release: VERCEL_GIT_COMMIT_SHA). So when an error shows up, Sentry doesn't just tell me what broke, it tells me which version broke, down to the commit. If a crash started an hour ago, I can see it landed with the deploy I shipped an hour ago. That is often the whole investigation, done!
Performance: errors are only half the story
Sometimes nothing crashes and the app is still bad, just slow. The interview takes four seconds to start. The voice lags. No error is thrown, the user simply suffers in silence.
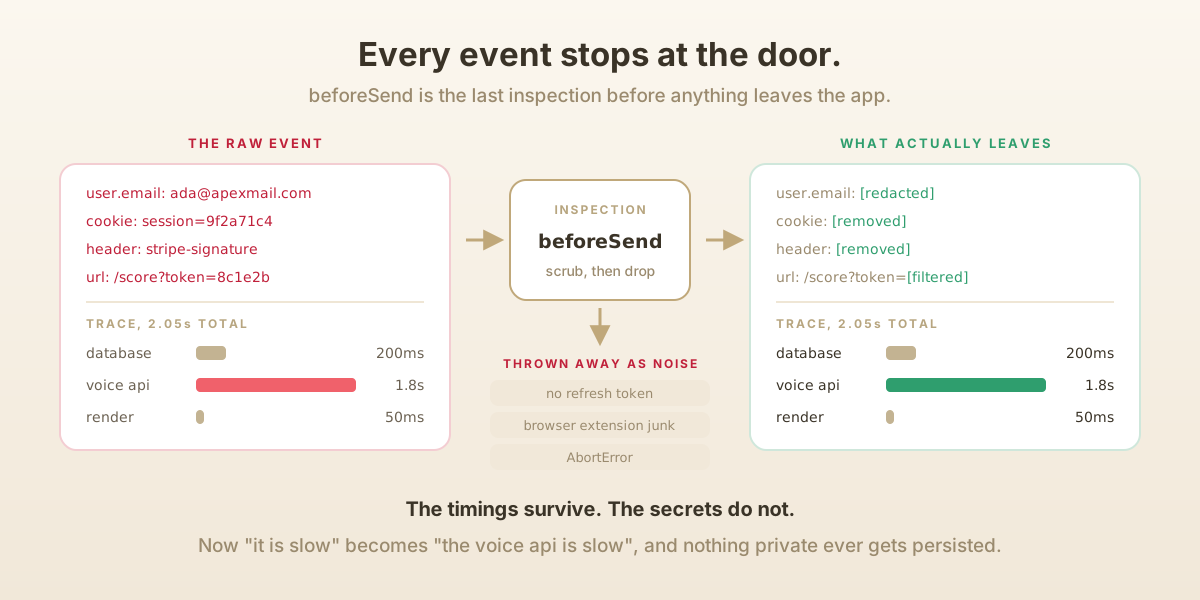
To see that, Sentry can record traces. A trace is basically a stopwatch wrapped around an operation, broken into segments: the request came in, spent 200ms in the database, 1.8s waiting on an external voice API, 50ms rendering. Now "it's slow" becomes "the voice API is slow," which is a much more fixable sentence.
Recording every single trace would be expensive and honestly overkill, so Apex Interviewer samples them. In production it keeps 10% of browser and server traces (tracesSampleRate: 0.1) and a thinner slice on the edge, which is enough to see the shape of performance without drowning in data or cost. In development it records everything, because there's only me poking at it anyway.
On the browser side I also turned on Session Replay, which is a privacy-scrubbed, rebuilt video of what the user actually did before things went wrong. It is sampled lightly during normal sessions but set to capture every session that ends in an error (replaysOnErrorSampleRate: 1.0), because those are exactly the ones worth watching. And it is locked down hard: all text masked, all inputs masked, all media blocked. So I get the shape of what happened (the clicks, the navigation, the moment it broke) without ever seeing what somebody actually typed.
The part nobody mentions: keeping secrets and noise out
A naive error report is honestly a liability. Stack traces and request data can quietly sweep up email addresses, auth cookies, Stripe signatures, session tokens, which are exactly the things you must never spray into a third-party dashboard.
So before any event leaves the app, it passes through a beforeSend hook, which is basically a final inspection station. Apex Interviewer runs every event through a scrubber that strips sensitive headers and cookies, redacts emails wherever they appear in free text, and cleans out query parameters like token and secret. So nothing sensitive gets persisted, by construction.
The same hook also throws away noise. A logged-out visitor hitting a page triggers a perfectly normal "no refresh token" message, which is not a bug, just life. Browser extensions inject errors that look like they came from my code but really didn't. A user navigating away mid-request cancels it with an AbortError. Left alone, these would bury the real incidents under thousands of shrugs. So they get filtered out right at the door. An alert that cries wolf gets ignored, so the discipline here is to make every single alert actually mean something.
There's even a wrapper for the app's scheduled jobs (withSentryCron) so that if a nightly task quietly fails to run at all, Sentry notices the silence and tells me. Because a job that doesn't run throws no error, so you have to watch for the absence. It is a bit like noticing your house help did not show up today rather than waiting for something to visibly break.
What it feels like now
Go back to that stranger with the white screen. Today, the moment their screen goes white, a report is already on its way to me: the real function names, the exact commit, the browser and the OS, a scrubbed replay of the last thirty seconds, and if it's a brand-new problem, an alert. The thing that used to be completely invisible now arrives before they've even closed the tab. 🚀
And it didn't take a rewrite. It took an address with a key in it, three small config files, a translation dictionary for the minified code, and the discipline to throw away the noise so the signal could actually be heard. That's the whole trick really: you can't fix what you can't see, so first, you build the eyes.
"For nothing is secret that will not be revealed, nor anything hidden that will not be known and come to light." - Luke 8:17